






Executive Summary
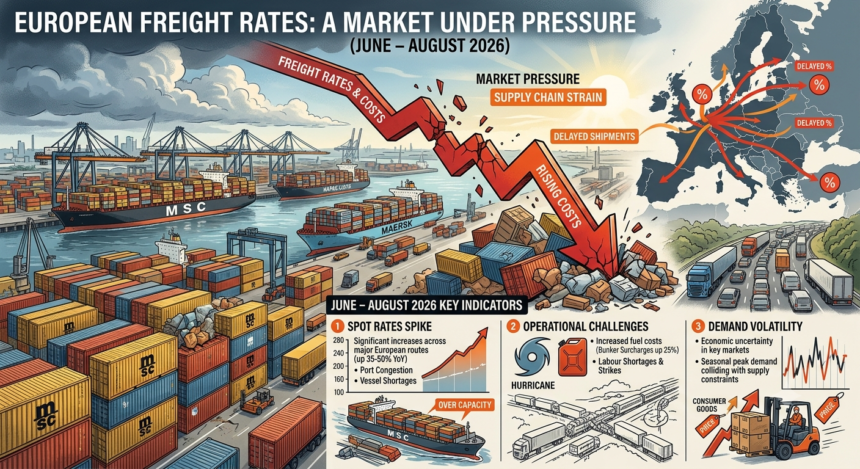
The period from June to August 2026 witnessed a complex and multi-layered increase in freight rates across Europe. Rather than a single driver, the market experienced simultaneous pressures from maritime, road, and inland waterway transport, each propelled by distinct operational and environmental factors. While ocean freight rates began to show signs of stabilization and slight decline by late July, road and inland waterway transport faced sustained upward pressure from structural cost increases and extreme weather events.
1. Ocean Freight: From Peak to Gradual Cooling
The June Peak
The summer of 2026 began with ocean freight rates at historic highs. In mid-June, the Shanghai Containerized Freight Index (SCFI) reached 2985.22, representing a steep 9.5% increase in a single week. Carriers systematically pushed up July rates across European and Mediterranean routes using mechanisms such as FAK (Freight All Kinds), PSS (Peak Season Surcharges), and GRI (General Rate Increases).
This surge was driven by multiple factors:
-
Route re-routing: Most shipping companies maintained the longer route around the Cape of Good Hope due to unresolved security risks in the Red Sea.
-
Operational bottlenecks: Port congestion and container shortages tightened capacity.
-
Early peak season demand: A precautionary mindset among importers led to concentrated bookings in June and early July.
A Turning Point in Late July
By late July, the market began to shift. Drewry’s WCI index for the Shanghai-Rotterdam route stood at $4,824 per FEU as of July 23, 2026, marking a 10% month-on-month decline. The fading of the seasonal impulse, coupled with simultaneous capacity growth, pointed toward a gradual cooling phase. Average quoted rates on the China-Northern Europe route for early August were approximately $5,400 per FEU.



However, analysts cautioned against interpreting this as a freefall. Carriers maintained price discipline through blank sailings, and futures traders expected rates to return to early 2026 levels (approximately $2,150 per FEU) only by late October — indicating a controlled, gradual descent rather than a crash.
2. Road Freight: Sustained Cost-Driven Pressure
Unlike ocean freight, European road freight experienced steady, structurally driven increases throughout the review period.
The Contract vs. Spot Divergence
In Q1 2026, the IRU-Upply-Ti benchmark showed contract rates reaching 140.1 index points, up 8.9 points year-on-year, while spot rates slipped to 132.3 points — the widest divergence since 2022. This pattern reflected a market where contracts absorbed rising costs while spot rates responded more to demand-supply dynamics.
Key Cost Drivers
Fuel: The primary factor remained energy costs. Average EU diesel rose from approximately €1.56/liter at the end of 2025 to €1.96/liter by March 2026 — a 26% increase. By June 2026, DHL’s road fuel surcharge had reached 20.96%, compared to just 8.73% in June 2025.
Tolls and regulations: Germany’s introduction of the Maut (Infrastructure Usage Charge), alongside an additional CO2 levy and minimum wage increases for drivers, created a perfect storm of rising operational costs. One forwarder reported that a 760km journey in southern Germany cost €1,300-1,400, compared to €1,050-1,100 previously. The Netherlands introduced a new toll system effective July 1, 2026, adding further pressure.
Labor: Minimum wages for drivers had increased by approximately €3 since the pandemic, with additional costs for hauliers rising between 69% and 83% depending on truck classification.
Outlook for Q3
Industry forecasts projected a 3-6% increase in average road freight rates for Q3 2026 compared to Q2, driven by recovering transport demand, reduced capacity, and toll system changes. The market anticipated that cost pressures would continue pushing tariffs higher even without a dramatic rebound in cargo volumes.
3. Inland Waterways: The Rhine and Danube Crisis
Perhaps the most dramatic development occurred on Europe’s inland waterways.
Historic Low Water Levels
Exceptionally low water levels on the Rhine and Danube disrupted commercial shipping in unprecedented ways. The Danube at Baziaș fell to approximately 1,700 cubic meters per second — barely a third of the July average of 4,700 cubic meters per second — its lowest level since 1996.
On the Rhine, the critical Kaub gauge — the shallowest point on the Middle Rhine — fell to 25 centimeters, matching the 2018 low, with forecasts suggesting a drop to 24 centimeters that would mark the lowest level since records began in 1880.
Operational and Cost Impact
At water levels of 40-50 centimeters, barges could carry only 20-30% of their normal volume. This capacity constraint had an immediate effect on freight rates:
-
Shipping costs for diesel moving from Rotterdam to southern Germany reportedly rose by more than 50% within a single week.
-
Freight rates from Rotterdam more than tripled in two months, from approximately €45 per ton in June to nearly €150 in July.
Broader Economic Implications
The disruption came at a particularly challenging time for European industry. In 2018, similar Rhine disruptions had led to a 10% drop in German chemical and pharmaceutical production over three months, costing BASF approximately €250 million. Economists estimated the 2022 drought may have cut up to half a percentage point from Germany’s annual economic growth. With extreme heat waves becoming more frequent, low-water disruptions are emerging as a recurring feature of European logistics.
Summary Comparison Table
| Transport Mode | June 2026 Status | August 2026 Status | Primary Drivers |
|---|---|---|---|
| Ocean Freight | SCFI at 2,985 (peak) | WCI $4,824/FEU (declining) | Red Sea route rerouting, seasonal demand, capacity management |
| Road Freight | Contract rates at 140.1 index; fuel surcharge at 20.96% | Projected 3-6% Q3 increase | Fuel costs (+26%), tolls, CO2 levies, labor costs |
| Inland Waterways | Rhine/Danube low water emerging | Barge capacity at 20-30% normal; rates up 3x in 2 months | Extreme heat and drought, historic low water levels |
Where to Stay Informed
In a market where freight rates, fuel surcharges, toll regulations, and weather-related disruptions shift weekly, timely information becomes a critical business asset. For logistics professionals, forwarders, and supply chain managers who need daily operational intelligence rather than monthly summaries, industry-specific news platforms are indispensable.
If you want to track the latest developments in European logistics, road and ocean freight trends, regulatory changes, and real-world rate movements, the news portal k2cargo.news provides up-to-date coverage tailored to the freight community. Their daily updates on cargo transportation news help professionals stay ahead of market shifts — from Rhine water levels to carrier rate announcements — so you can make informed decisions in real time.
Conclusion
The freight rate environment in Europe from June to August 2026 cannot be characterized by a single trend line. Instead, it reflects a market segmented by mode:
-
Ocean freight experienced a classic peak-season surge followed by gradual normalization, with rates beginning to cool in late July as seasonal demand subsided and capacity constraints eased.
-
Road freight faced relentless cost-driven pressure from fuel, tolls, and regulatory changes that pushed contract rates steadily upward, with further increases expected in Q3.
-
Inland waterway transport witnessed a crisis scenario as extreme weather events crippled the Rhine and Danube, triggering emergency-level rate spikes that rippled through energy and industrial supply chains.
For businesses operating in this environment, the summer of 2026 offered no single solution. The key takeaway remains one of segmented risk management: understanding which costs are structural (road freight), which are cyclical (ocean freight), and which are weather-dependent (inland waterways) will be essential for planning through the remainder of the year.